Area chart & Sparkline
A filled line chart, plus Sparkline for inline trends.
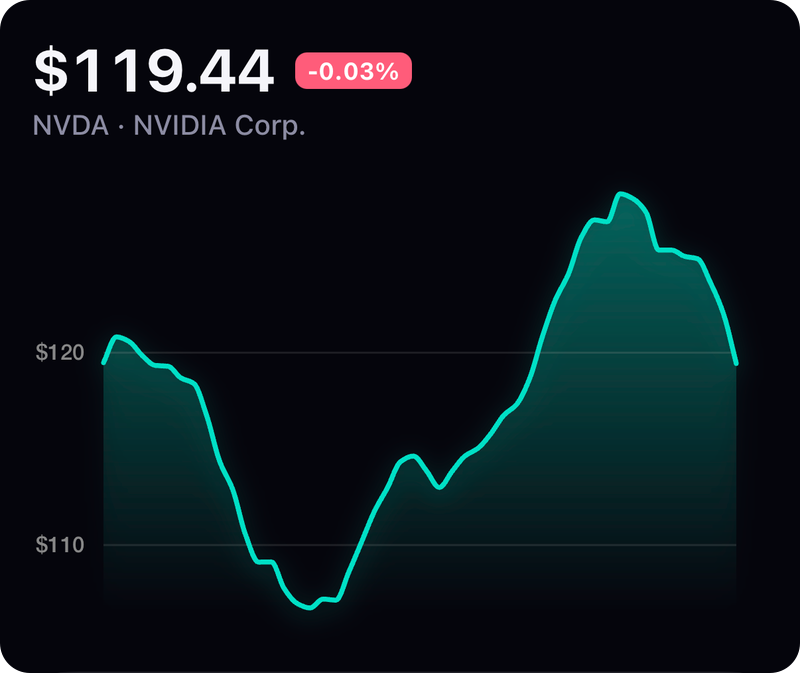
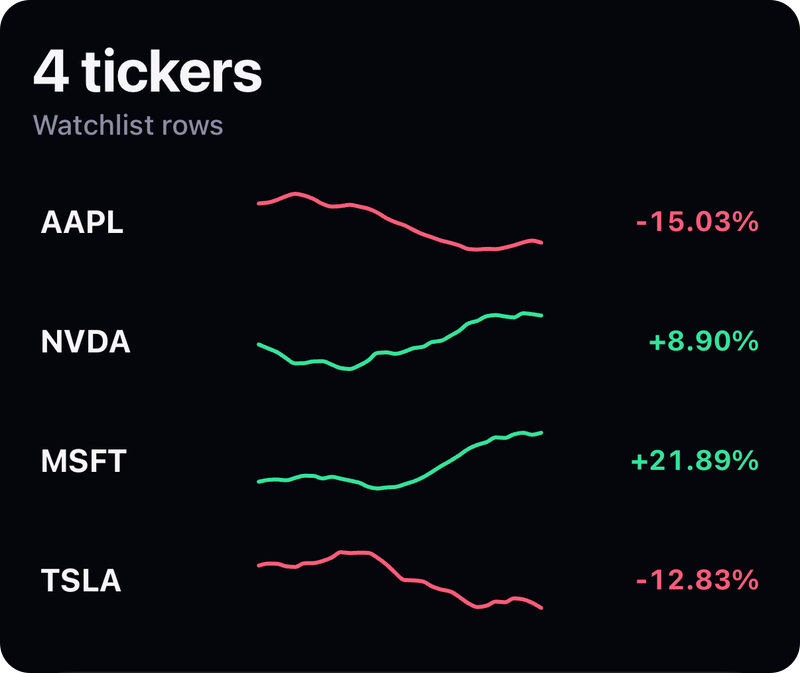
Screenshot from the example app. Run it to try every option live.
Usage
import { AreaChart, Sparkline } from 'react-native-skia-chart';

<AreaChart width={w} height={200} data={values} color="#00B894" />
<Sparkline width={120} height={36} data={values} />
Props
| Prop | Type | Default | Notes |
|---|---|---|---|
…LineChart props | Everything from LineChart. | ||
fill | true | true | Always on for AreaChart. |
Sparkline: data, color, strokeWidth, fill, gradient | Minimal inline trend, no grid or gestures. |
All charts also accept the shared props: width, height, padding, style, backgroundColor, animation, font, effects and gradient.
Gradient
<AreaChart {...props} gradient={{ type: 'linear', colors: ['#FF6B9A', '#FFC048'], start: [0, 0], end: [1, 1] }} />
GPU notes
In tint mode the gradient keeps the fill's alpha, so the vertical fade under the area is preserved while its colour follows your gradient.