Bar chart
Vertical, horizontal and grouped bars with staggered entry.
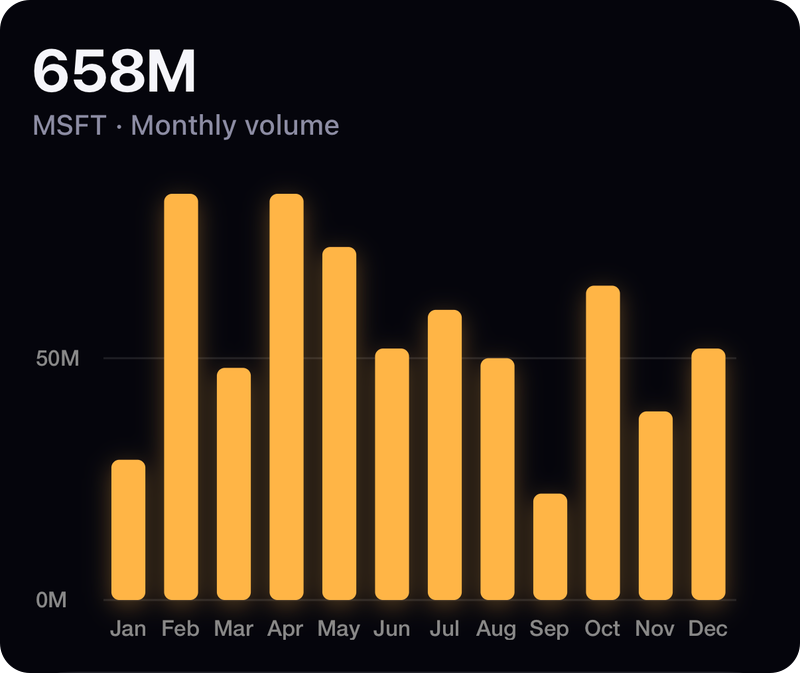
Screenshot from the example app. Run it to try every option live.
Usage
import { BarChart } from 'react-native-skia-chart';

<BarChart width={w} height={200} data={[4, 8, 6, 9, 3]} labels={['M','T','W','T','F']} radius={6} />
Props
| Prop | Type | Default | Notes |
|---|---|---|---|
data | number[] | — | Single series. |
color | string | '#00B894' | |
series | { data, color }[] | — | Grouped (or stacked with stacked). |
stacked | boolean | false | |
horizontal | boolean | false | |
labels | string[] | — | Category labels. |
barWidthRatio | number | 0.7 | |
radius | number | 4 | Corner radius. |
showGrid | boolean | true | |
formatY | (v) => string | — | |
stagger | number | 0.4 | Fraction of the duration spread across bars. |
All charts also accept the shared props: width, height, padding, style, backgroundColor, animation, font, effects and gradient.
Gradient
<BarChart {...props} gradient={{ type: 'linear', colors: ['#7C5CFF', '#00D2D3'] } // top → bottom by default} />
GPU notes
Each bar's height is a Reanimated value; rounded rects are drawn in one GPU pass. A linear gradient is evaluated across the whole chart, so bars of different heights sample different colours, a natural "heat" look.