Gauge
Speedometer-style dial with an animated needle.
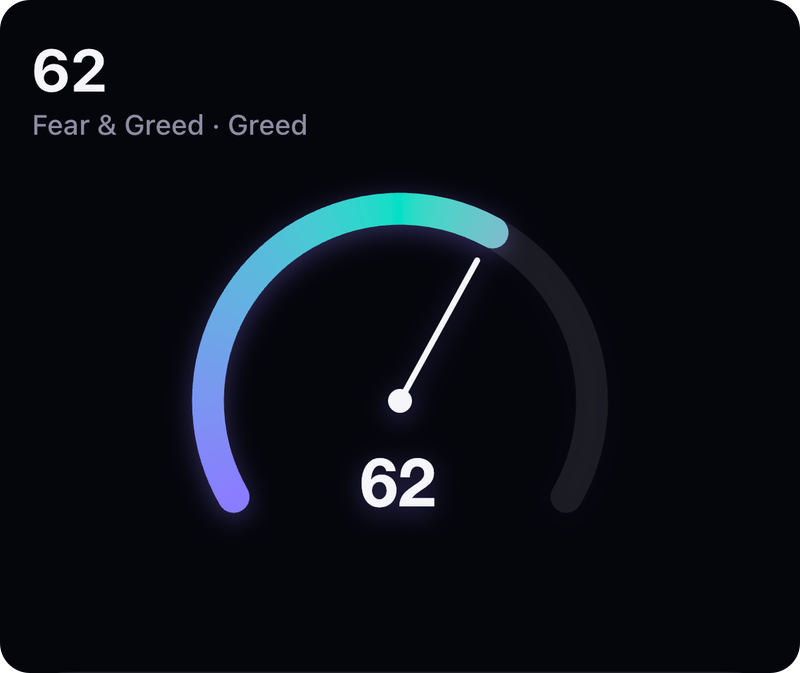
Screenshot from the example app. Run it to try every option live.
Usage
import { GaugeChart } from 'react-native-skia-chart';

<GaugeChart width={260} height={200} value={72} gradient={['#4CD97B', '#FFC048', '#FF5A5F']} />
Props
| Prop | Type | Default | Notes |
|---|---|---|---|
value | number | — | |
min / max | number | 0 / 100 | |
sweep | number (deg) | 240 | |
thickness | number | 16 | |
color | string | '#6C5CE7' | |
gradient | string[] | ChartGradient | — | Sweep gradient along the arc (track stays untinted). |
trackColor | string | — | |
showNeedle | boolean | true | |
needleColor | string | — | |
formatValue | (v) => string | — | |
valueFont | SkFont | — | |
valueColor | string | — |
All charts also accept the shared props: width, height, padding, style, backgroundColor, animation, font, effects and gradient.
Gradient
<GaugeChart {...props} gradient={{ colors: ['#4CD97B', '#FFC048', '#FF5A5F'], positions: [0, 0.6, 1] }} />
GPU notes
For gauges, gradient always becomes a SweepGradient aligned to the dial's start and end angles, so it is backward compatible with the old string[] form.