Line chart
Time series with morphing updates and UI-thread scrubbing.
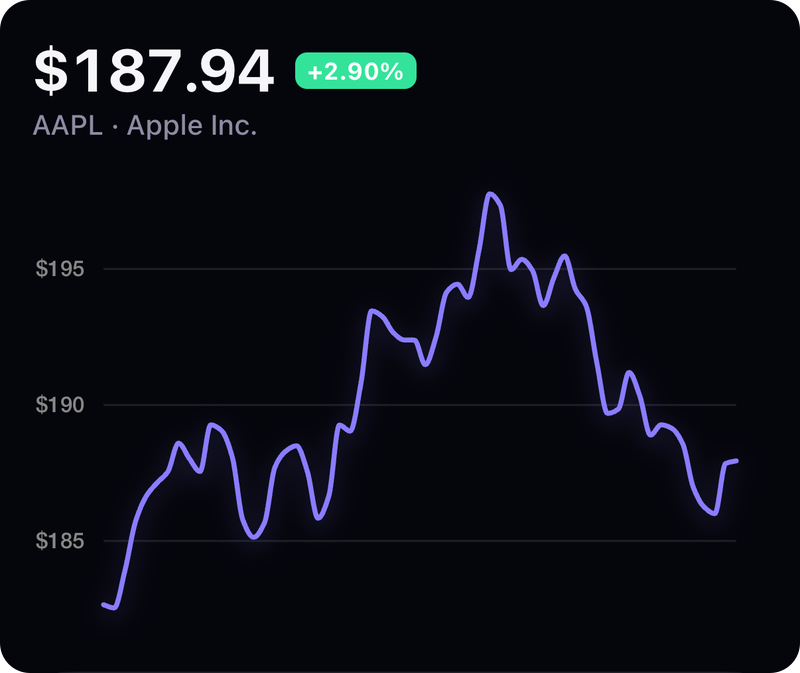
Screenshot from the example app. Run it to try every option live.
Usage
import { LineChart } from 'react-native-skia-chart';

<LineChart width={w} height={220} data={values} curve="monotone" interactive onScrub={(p, i) => {}} />
Props
| Prop | Type | Default | Notes |
|---|---|---|---|
data | number[] | { x, y }[] | — | Single series values. |
color | string | '#6C5CE7' | Stroke colour. |
strokeWidth | number | 2.5 | |
series | LineSeries[] | — | Multiple series (data, color, fill, fillOpacity). |
curve | 'linear' | 'monotone' | 'step' | 'monotone' | |
fill | boolean | false | Vertical fade under the line. |
showGrid | boolean | true | |
gridTicks | number | 4 | |
formatY | (v) => string | — | Axis label formatter. |
yDomain | [min, max] | auto | |
interactive | boolean | false | Pan gesture scrubbing with cursor + tooltip. |
cursorColor | string | — | |
onScrub | (point, index) => void | — | Called on the JS thread. |
entry | 'draw' | 'grow' | 'none' | 'draw' | Mount animation. |
All charts also accept the shared props: width, height, padding, style, backgroundColor, animation, font, effects and gradient.
Gradient
<LineChart {...props} gradient={{ type: 'linear', colors: ['#7C5CFF', '#00D2D3'], start: [0, 0.5], end: [1, 0.5] }} />
GPU notes
Path morphing uses SkPath.interpolate inside a Reanimated derived value, so data changes animate without React re-renders. The scrub cursor is driven by shared values on the UI thread; the cursor keeps its last index while fading out on release.