Radar chart
Multi-axis comparison.
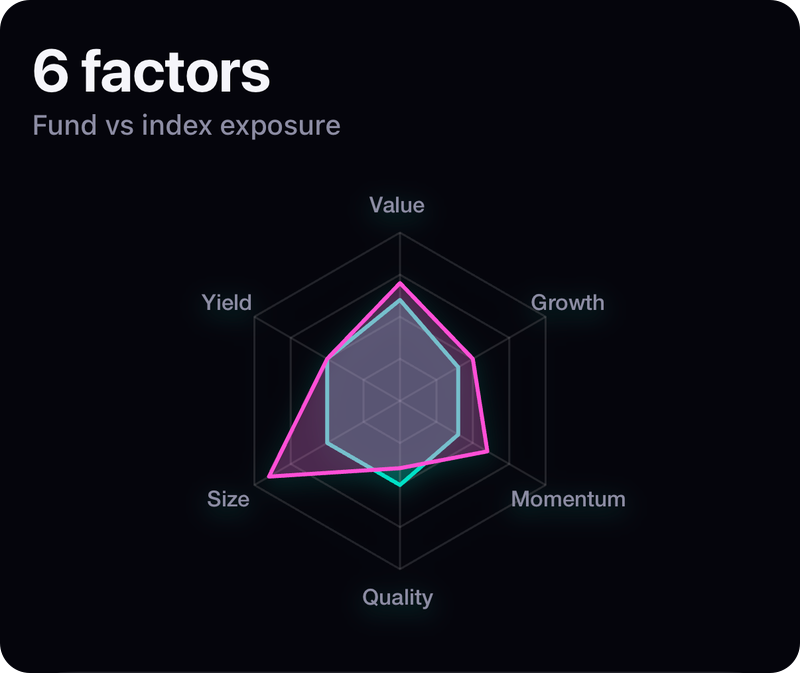
Screenshot from the example app. Run it to try every option live.
Usage
import { RadarChart } from 'react-native-skia-chart';

<RadarChart width={260} height={260} axes={['Speed','Power','Range','Cost','Comfort']} series={[{ data: [7, 5, 8, 4, 6], color: '#7C5CFF' }]} />
Props
| Prop | Type | Default | Notes |
|---|---|---|---|
axes | string[] | — | |
series | { data, color }[] | — | |
max | number | auto | |
rings | number | 4 | |
gridColor | string | — | |
labelColor | string | — |
All charts also accept the shared props: width, height, padding, style, backgroundColor, animation, font, effects and gradient.
Gradient
<RadarChart {...props} gradient={{ type: 'radial', colors: ['#00D2D3', '#7C5CFF'] }} />
GPU notes
A radial gradient centred on the web emphasises values far from the centre.