Stacked area chart
Layered areas, absolute or 100% stacked.
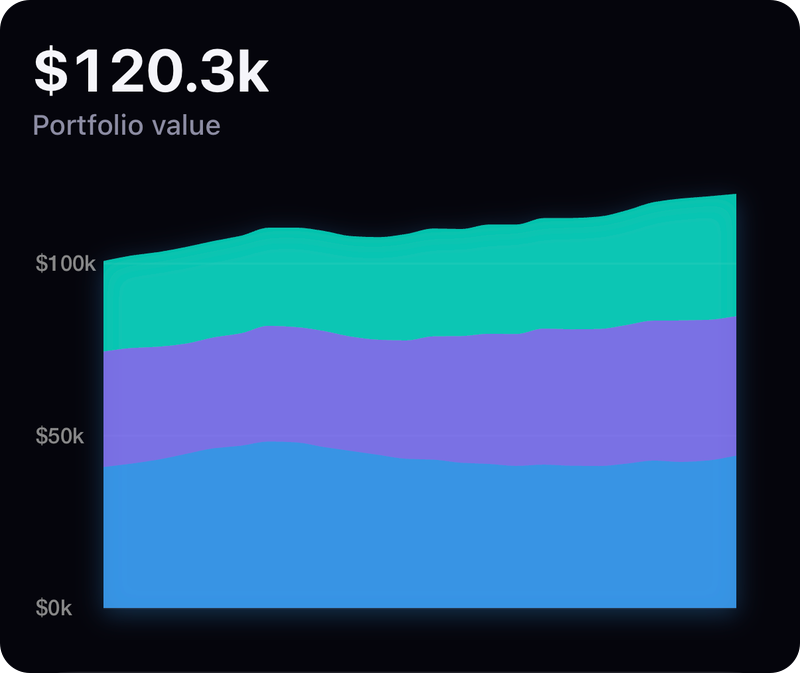
Screenshot from the example app. Run it to try every option live.
Usage
import { StackedAreaChart } from 'react-native-skia-chart';

<StackedAreaChart width={w} height={200} percent series={[{ data: a, color: '#6C5CE7' }, { data: b, color: '#00CEC9' }]} />
Props
| Prop | Type | Default | Notes |
|---|---|---|---|
series | { data, color }[] | — | |
curve | 'linear' | 'monotone' | 'step' | 'monotone' | |
percent | boolean | false | Normalise to 100%. |
showGrid | boolean | true | |
formatY | (v) => string | — | |
fillOpacity | number | 0.85 |
All charts also accept the shared props: width, height, padding, style, backgroundColor, animation, font, effects and gradient.
Gradient
<StackedAreaChart {...props} gradient={{ type: 'linear', colors: ['#FFFFFF', '#000000'], mode: 'overlay', opacity: 0.25 }} />
GPU notes
Gradient overlay adds depth while keeping series colours distinct.